Back to the editor

Indicator library

Volume and order flow indicators written by the PineScripter team in Pine Script v6. Each one compiles on TradingView, runs on the chart in the app, and opens in the editor so you can read it and change it with the AI.

For analysis and education. Indicators describe past price and volume, not what will happen next.

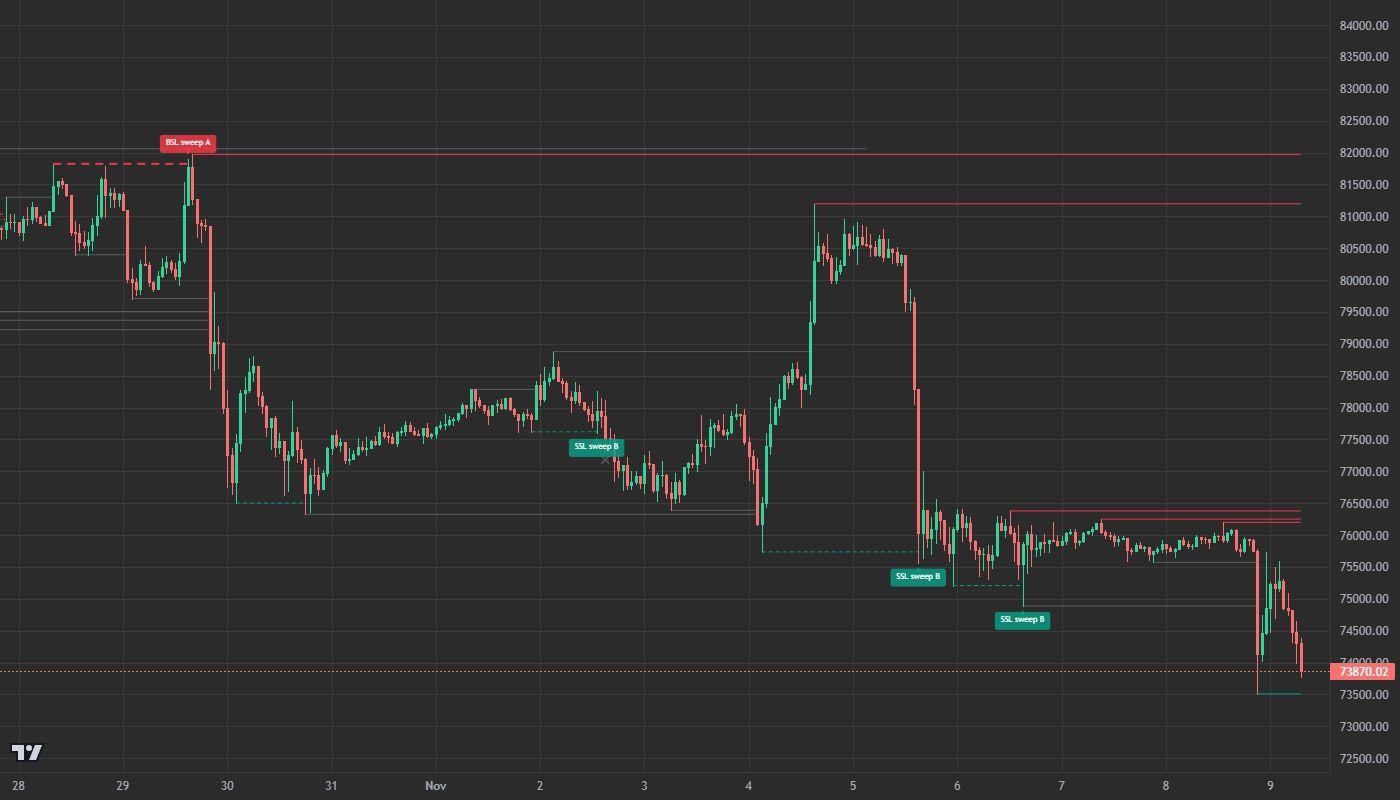
Liquidity Sweeps on a BTCUSDT 1 hour chart

Liquidity Sweeps

FreeStructure

Stops and breakout orders cluster just beyond obvious swing highs and lows. This indicator draws those pools as lines, merges equal highs and lows into stronger pools, and marks the bar that sweeps one: a wick through the level, a close back inside, on volume above its average. If price closes back beyond the level within a few bars, the sweep is marked as failed.
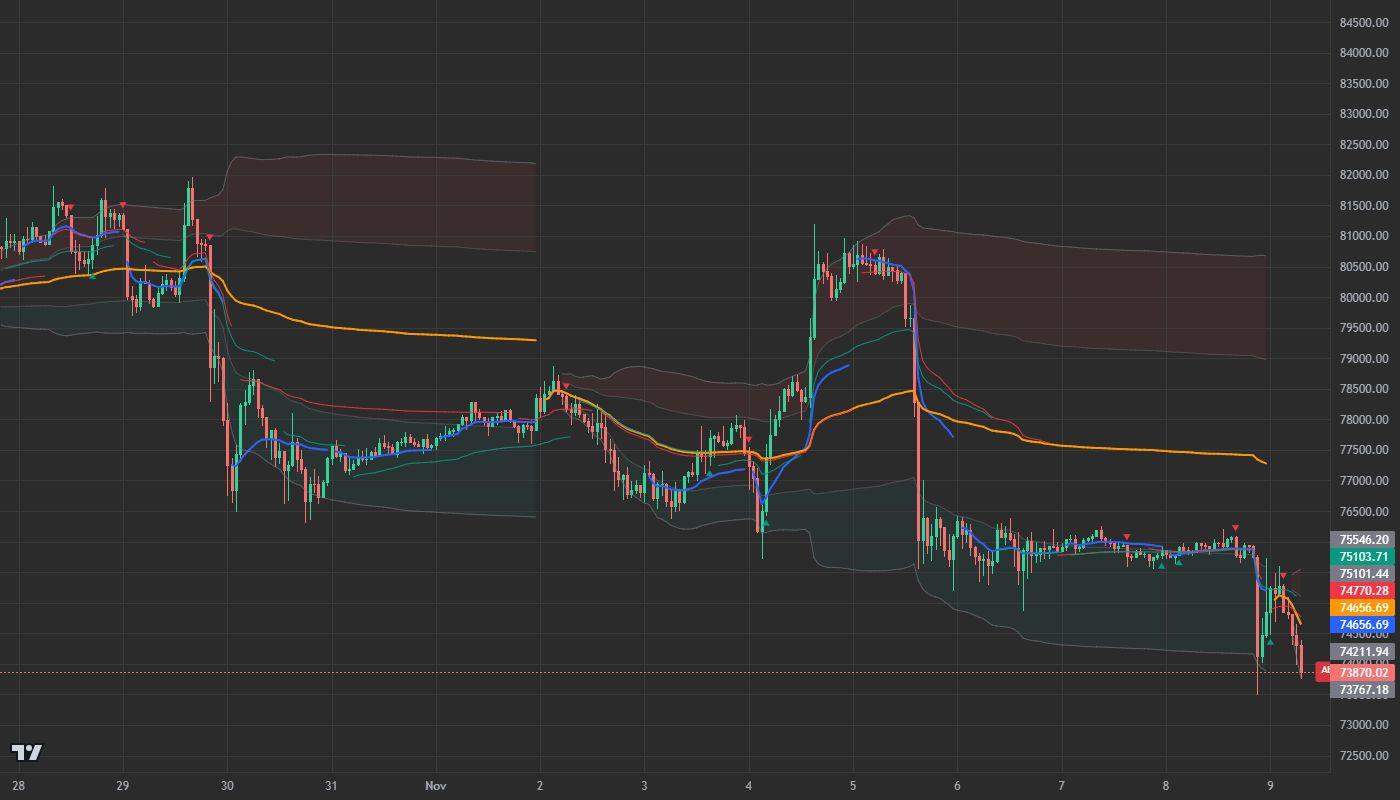
Anchored VWAP Engine on a BTCUSDT 1 hour chart

Anchored VWAP Engine

FreeVolume

The volume-weighted average price is the level many large traders measure their fills against. This indicator anchors it automatically to the points that matter: the session, the week, the most recent confirmed swing high and swing low, and the most recent volume climax. One anchor carries standard deviation bands, and a label on the last bar tells you how many VWAPs price is above.

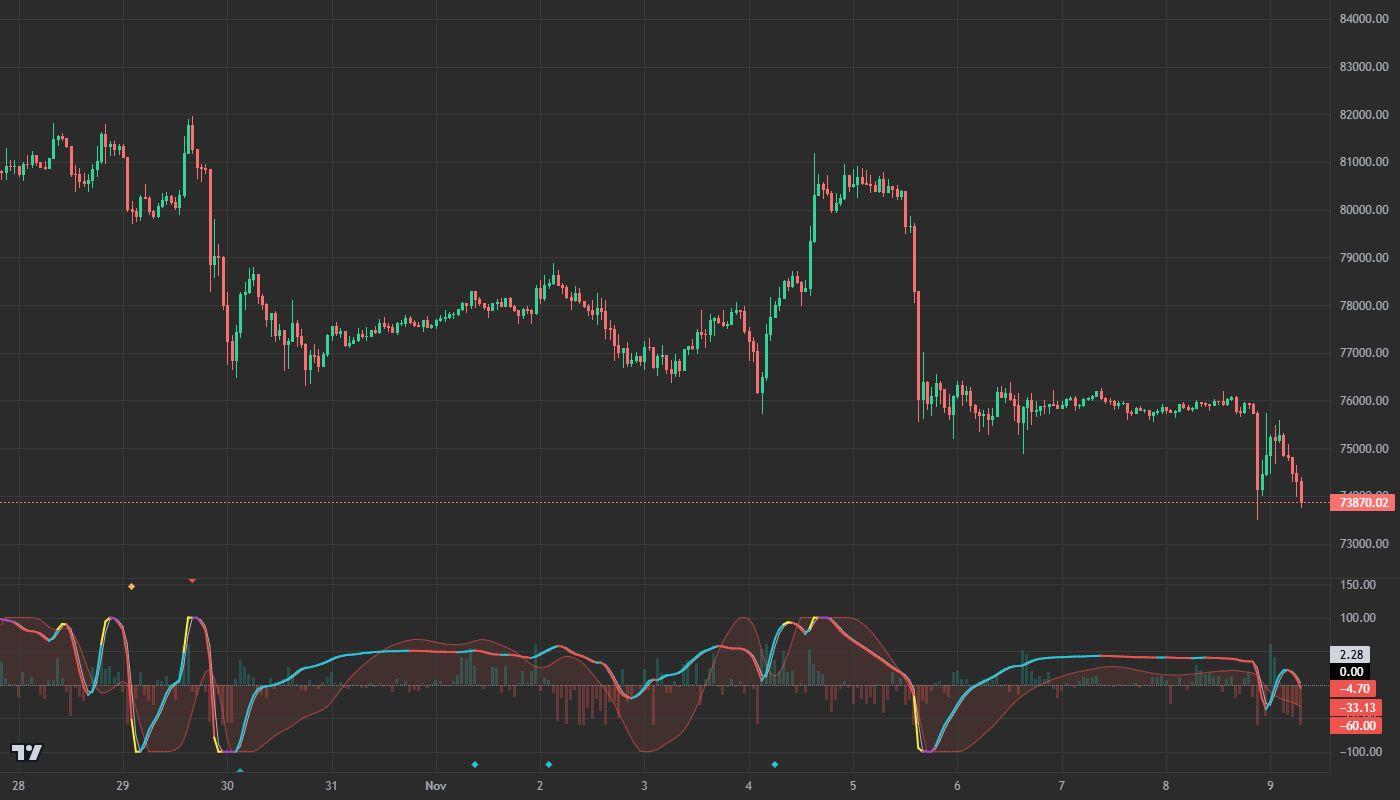
Volume Pulse on a BTCUSDT 1 hour chart

Volume Pulse

Paid plansMomentum and volume

Volume Pulse weights every price move by how much heavier than usual its volume was, then filters the result with an Ehlers roofing filter and normalises it to a -100 to +100 scale that reads the same on every market. Wave shows the slower cycle of price alone, and Flow shows whether volume closed near the highs or the lows. A trigger is graded by how many of them agree, so a single glance tells you how much is lined up behind a turn.

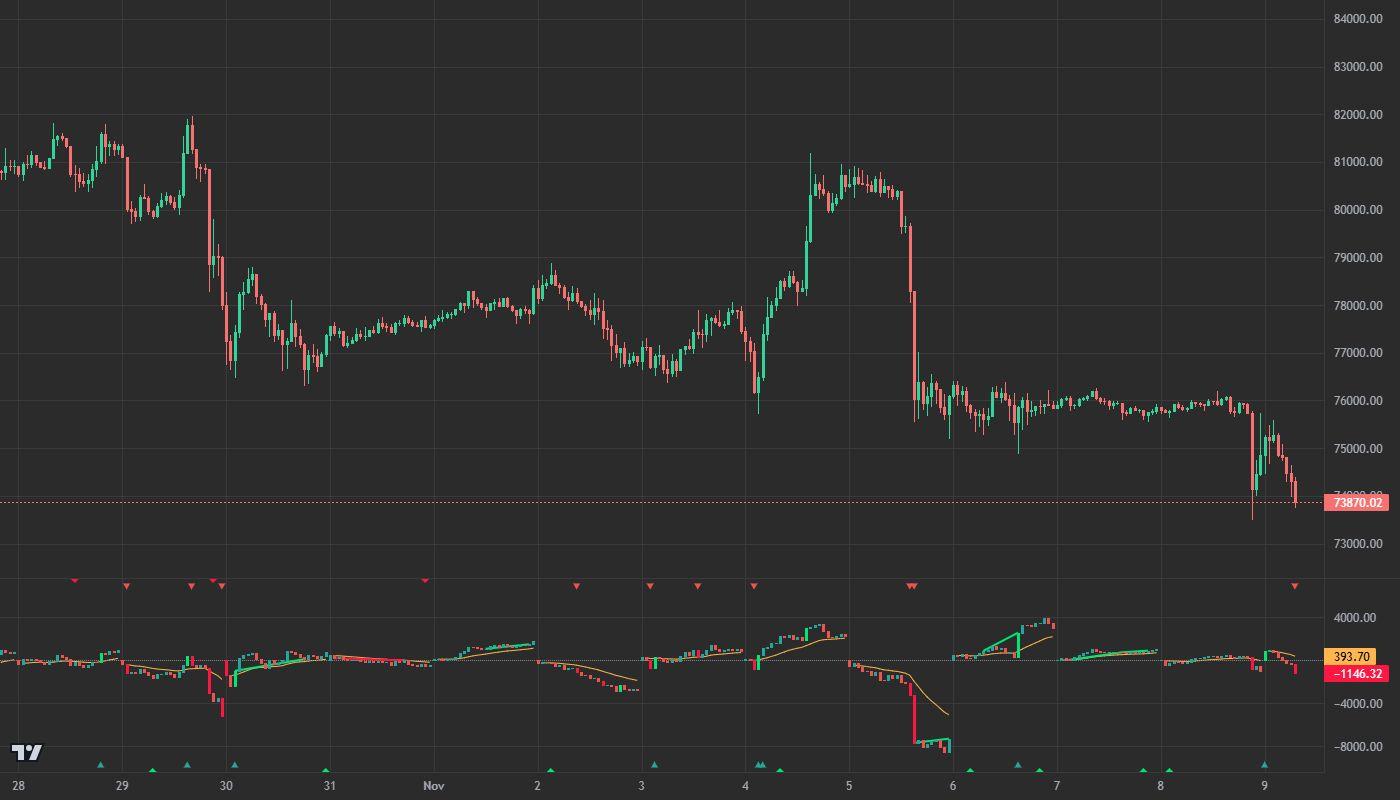
Delta Flow on a BTCUSDT 1 hour chart

Delta Flow

Paid plansVolume

Delta Flow splits each bar's volume into estimated buying and selling by where the close sits in the bar's range, then builds cumulative delta as candles that reset each session, each week, or never. It marks divergences where price makes a new swing that delta does not confirm, absorption where heavy volume failed to move price, and imbalance where one side took most of a wide, heavy bar. The split is an estimate from bar data, not exchange order flow.

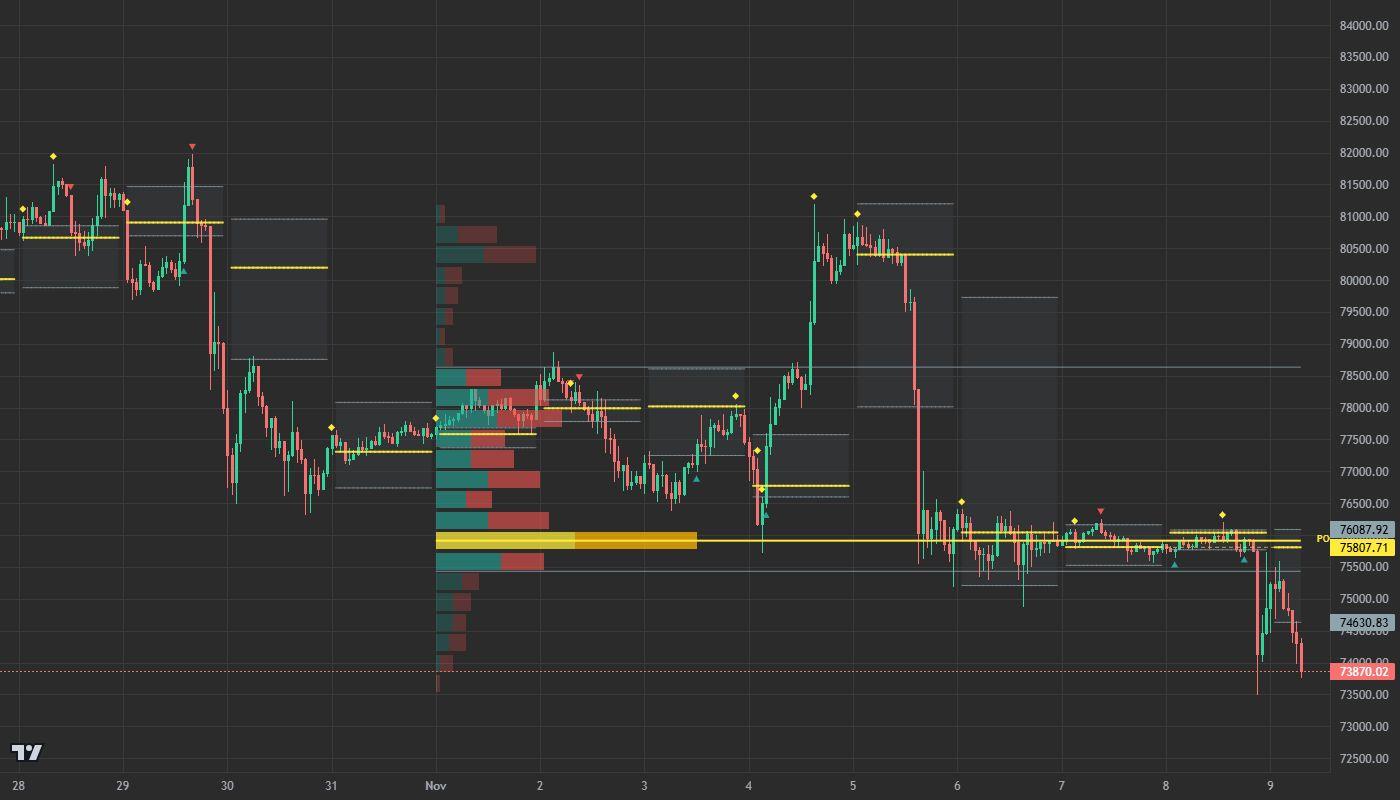
Volume Profile Suite on a BTCUSDT 1 hour chart

Volume Profile Suite

Paid plansVolume

Volume Profile Suite shows where volume actually traded over the last N bars, row by row, split into estimated buying and selling. It marks the point of control (the busiest price) and the value area that holds 70 percent of the volume. Underneath, it carries the prior session's POC and value area forward as levels, and keeps up to ten naked POCs: session POCs price has not traded back through since. Each bar's volume is spread across its range, so the profile is an estimate from bar data rather than an exchange footprint.